| Dependant variable | prix 2004 |
| Independant variable(s) | note note2 note3 note4 |
| Examples | 312 |
| R2 | 0.72224406472082 |
| Adjusted R2 | 0.72045209094483 |
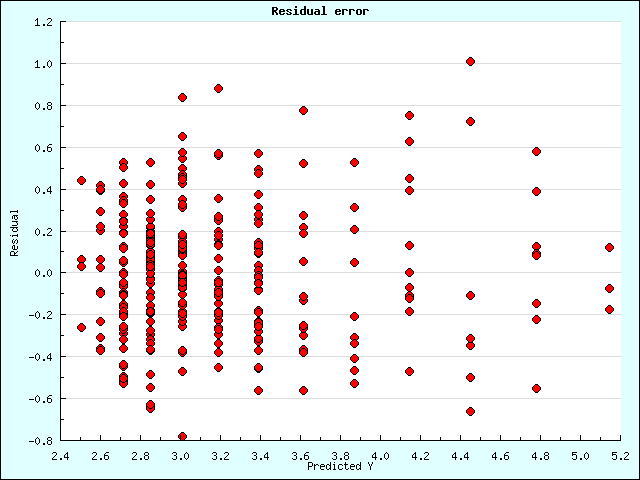
| Sigma error | 0.35628985970162 |
| F-Test(2,310) | 403.04388066166(p < .0000*) |
| Source of variation | SS | df | MS | F Obs | F Stat |
|---|---|---|---|---|---|
| Regression | SSR = 102.33 | dfR = 2 | MSR = 51.16 | MSR/MSE = 403.04 | p < .0000* |
| Error | SSE = 39.35 | dfE = 310 | MSE = 0.13 | ||
| Total | SSTO = 141.68 | dfTO = 312 |
| Parameter | Estimate | SE | T Obs | T Stat |
|---|---|---|---|---|
| Intercept | b0=12.716358 | s{b0}=3.255371 | t0=3.906270 | p = 0.0001* |
| note4 | b1=0.000001 | s{b1}=0.000000 | t1=4.876306 | p < .0000* |
| note3 | b2=-0.000079 | s{b2}=0.000018 | t2=-4.370805 | p = 0.0000* |
| Step | 1 | 2 | 3 |
|---|---|---|---|
| R2 | 0.7051 | 0.7222 | |
| note | 696.36(0.0000) | 19.05(0.0000) | 0.04(0.8461) |
| note2 | 713.09(0.0000) | 19.08(0.0000) | 0.04(0.8406) |
| note3 | 728.92(0.0000) | 19.1(0.0000) | |
| note4 | 743.69(0.0000) |
| Dependant variable | prix |
| Independant variable(s) | note note2 note3 note4 |
| Examples | 311 |
| R2 | 0.73098633504763 |
| Adjusted R2 | 0.72924514627771 |
| Sigma error | 0.34816829339746 |
| F-Test(2,309) | 419.8202674383(p < .0000*) |
| Source of variation | SS | df | MS | F Obs | F Stat |
|---|---|---|---|---|---|
| Regression | SSR = 101.78 | dfR = 2 | MSR = 50.89 | MSR/MSE = 419.82 | p < .0000* |
| Error | SSE = 37.46 | dfE = 309 | MSE = 0.12 | ||
| Total | SSTO = 139.24 | dfTO = 311 |
| Parameter | Estimate | SE | T Obs | T Stat |
|---|---|---|---|---|
| Intercept | b0=13.419981 | s{b0}=3.186140 | t0=4.211987 | p = 0.0000* |
| note4 | b1=0.000001 | s{b1}=0.000000 | t1=5.197638 | p < .0000* |
| note3 | b2=-0.000082 | s{b2}=0.000018 | t2=-4.682969 | p < .0000* |
| Step | 1 | 2 | 3 |
|---|---|---|---|
| R2 | 0.7119 | 0.731 | |
| note | 714.2(0.0000) | 21.85(0.0000) | 0.09(0.7625) |
| note2 | 732.39(0.0000) | 21.89(0.0000) | 0.09(0.7583) |
| note3 | 749.71(0.0000) | 21.93(0.0000) | |
| note4 | 765.99(0.0000) |
| Dependant variable | prix |
| Independant variable(s) | note note2 note3 note4 |
| Examples | 310 |
| R2 | 0.74206019890881 |
| Adjusted R2 | 0.74038526513549 |
| Sigma error | 0.34088228889524 |
| F-Test(2,308) | 443.0385312717(p < .0000*) |
| Source of variation | SS | df | MS | F Obs | F Stat |
|---|---|---|---|---|---|
| Regression | SSR = 102.96 | dfR = 2 | MSR = 51.48 | MSR/MSE = 443.04 | p < .0000* |
| Error | SSE = 35.79 | dfE = 308 | MSE = 0.12 | ||
| Total | SSTO = 138.75 | dfTO = 310 |
| Parameter | Estimate | SE | T Obs | T Stat |
|---|---|---|---|---|
| Intercept | b0=12.201340 | s{b0}=3.136008 | t0=3.890723 | p = 0.0001* |
| note4 | b1=0.000001 | s{b1}=0.000000 | t1=4.915430 | p < .0000* |
| note3 | b2=-0.000076 | s{b2}=0.000017 | t2=-4.386485 | p = 0.0000* |
| Step | 1 | 2 | 3 |
|---|---|---|---|
| R2 | 0.7259 | 0.7421 | |
| note | 764.98(0.0000) | 19.1(0.0000) | 0.4(0.5301) |
| note2 | 783.91(0.0000) | 19.17(0.0000) | 0.4(0.5269) |
| note3 | 801.81(0.0000) | 19.24(0.0000) | |
| note4 | 818.52(0.0000) |
| Dependant variable | prix |
| Independant variable(s) | note note2 note3 note4 |
| Examples | 309 |
| R2 | 0.74818955614393 |
| Adjusted R2 | 0.7465490972263 |
| Sigma error | 0.33392668991616 |
| F-Test(2,307) | 456.08551857261(p < .0000*) |
| Source of variation | SS | df | MS | F Obs | F Stat |
|---|---|---|---|---|---|
| Regression | SSR = 101.71 | dfR = 2 | MSR = 50.86 | MSR/MSE = 456.09 | p < .0000* |
| Error | SSE = 34.23 | dfE = 307 | MSE = 0.11 | ||
| Total | SSTO = 135.95 | dfTO = 309 |
| Parameter | Estimate | SE | T Obs | T Stat |
|---|---|---|---|---|
| Intercept | b0=12.770990 | s{b0}=3.075799 | t0=4.152089 | p = 0.0000* |
| note4 | b1=0.000001 | s{b1}=0.000000 | t1=5.186167 | p < .0000* |
| note3 | b2=-0.000079 | s{b2}=0.000017 | t2=-4.649980 | p < .0000* |
| Step | 1 | 2 | 3 |
|---|---|---|---|
| R2 | 0.7305 | 0.7482 | |
| note | 777.21(0.0000) | 21.41(0.0000) | 0.78(0.3770) |
| note2 | 797.4(0.0000) | 21.52(0.0000) | 0.79(0.3746) |
| note3 | 816.61(0.0000) | 21.62(0.0000) | |
| note4 | 834.66(0.0000) |
| Dependant variable | prix |
| Independant variable(s) | note note2 note3 note4 |
| Examples | 308 |
| R2 | 0.74387586898018 |
| Adjusted R2 | 0.74220185505195 |
| Sigma error | 0.32642727813494 |
| F-Test(2,306) | 444.36659482569(p < .0000*) |
| Source of variation | SS | df | MS | F Obs | F Stat |
|---|---|---|---|---|---|
| Regression | SSR = 94.70 | dfR = 2 | MSR = 47.35 | MSR/MSE = 444.37 | p < .0000* |
| Error | SSE = 32.61 | dfE = 306 | MSE = 0.11 | ||
| Total | SSTO = 127.30 | dfTO = 308 |
| Parameter | Estimate | SE | T Obs | T Stat |
|---|---|---|---|---|
| Intercept | b0=11.248653 | s{b0}=3.031858 | t0=3.710152 | p = 0.0002* |
| note4 | b1=0.000001 | s{b1}=0.000000 | t1=4.712713 | p < .0000* |
| note3 | b2=-0.000070 | s{b2}=0.000017 | t2=-4.181516 | p = 0.0000* |
| Step | 1 | 2 | 3 |
|---|---|---|---|
| R2 | 0.7292 | 0.7439 | |
| note | 774.24(0.0000) | 17.35(0.0000) | 0.41(0.5220) |
| note2 | 792.93(0.0000) | 17.42(0.0000) | 0.42(0.5187) |
| note3 | 810.53(0.0000) | 17.49(0.0000) | |
| note4 | 826.85(0.0000) |
| Dependant variable | prix |
| Independant variable(s) | note note2 note3 note4 |
| Examples | 307 |
| R2 | 0.73983941336501 |
| Adjusted R2 | 0.73813344230511 |
| Sigma error | 0.31828745944971 |
| F-Test(2,305) | 433.67641500771(p < .0000*) |
| Source of variation | SS | df | MS | F Obs | F Stat |
|---|---|---|---|---|---|
| Regression | SSR = 87.87 | dfR = 2 | MSR = 43.93 | MSR/MSE = 433.68 | p < .0000* |
| Error | SSE = 30.90 | dfE = 305 | MSE = 0.10 | ||
| Total | SSTO = 118.77 | dfTO = 307 |
| Parameter | Estimate | SE | T Obs | T Stat |
|---|---|---|---|---|
| Intercept | b0=9.617035 | s{b0}=2.982855 | t0=3.224104 | p = 0.0014* |
| note4 | b1=0.000001 | s{b1}=0.000000 | t1=4.194254 | p = 0.0000* |
| note3 | b2=-0.000061 | s{b2}=0.000017 | t2=-3.667715 | p = 0.0003* |
| Step | 1 | 2 | 3 |
|---|---|---|---|
| R2 | 0.7284 | 0.7398 | |
| note | 773.14(0.0000) | 13.38(0.0003) | 0.13(0.7145) |
| note2 | 790.21(0.0000) | 13.42(0.0003) | 0.14(0.7102) |
| note3 | 806.06(0.0000) | 13.45(0.0003) | |
| note4 | 820.51(0.0000) |
| Dependant variable | prix |
| Independant variable(s) | note note2 note3 note4 |
| Examples | 306 |
| R2 | 0.74821092022384 |
| Adjusted R2 | 0.74655441312005 |
| Sigma error | 0.31251318865332 |
| F-Test(2,304) | 451.67987418329(p < .0000*) |
| Source of variation | SS | df | MS | F Obs | F Stat |
|---|---|---|---|---|---|
| Regression | SSR = 88.23 | dfR = 2 | MSR = 44.11 | MSR/MSE = 451.68 | p < .0000* |
| Error | SSE = 29.69 | dfE = 304 | MSE = 0.10 | ||
| Total | SSTO = 117.92 | dfTO = 306 |
| Parameter | Estimate | SE | T Obs | T Stat |
|---|---|---|---|---|
| Intercept | b0=9.924378 | s{b0}=2.930044 | t0=3.387109 | p = 0.0008* |
| note4 | b1=0.000001 | s{b1}=0.000000 | t1=4.379589 | p = 0.0000* |
| note3 | b2=-0.000062 | s{b2}=0.000016 | t2=-3.842679 | p = 0.0001* |
| Step | 1 | 2 | 3 |
|---|---|---|---|
| R2 | 0.736 | 0.7482 | |
| note | 798.73(0.0000) | 14.71(0.0002) | 0.06(0.8131) |
| note2 | 817.21(0.0000) | 14.74(0.0002) | 0.06(0.8088) |
| note3 | 834.44(0.0000) | 14.77(0.0001) | |
| note4 | 850.22(0.0000) |