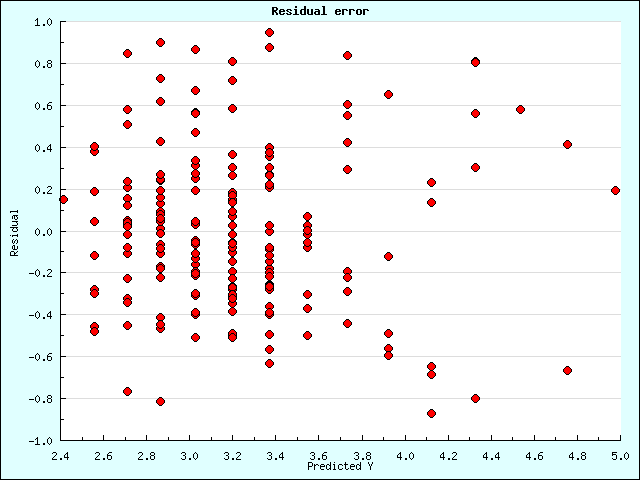
| Dependant variable | prix 2003 € |
| Independant variable(s) | note note2 note3 note4 |
| Examples | 223 |
| R2 | 0.55163301299469 |
| Adjusted R2 | 0.54961334188205 |
| Sigma error | 0.49821067662808 |
| F-Test(1,222) | 273.13011982162(p < .0000*) |
| Source of variation | SS | df | MS | F Obs | F Stat |
|---|---|---|---|---|---|
| Regression | SSR = 67.79 | dfR = 1 | MSR = 67.79 | MSR/MSE = 273.13 | p < .0000* |
| Error | SSE = 55.10 | dfE = 222 | MSE = 0.25 | ||
| Total | SSTO = 122.90 | dfTO = 223 |
| Parameter | Estimate | SE | T Obs | T Stat |
|---|---|---|---|---|
| Intercept | b0=-1.476998 | s{b0}=0.290462 | t0=-5.084986 | p < .0000* |
| note4 | b1=0.000000 | s{b1}=0.000000 | t1=16.526649 | p < .0000* |
| Step | 1 | 2 |
|---|---|---|
| R2 | 0.5516 | |
| note | 263.14(0.0000) | 3.01(0.0841) |
| note2 | 266.98(0.0000) | 2.95(0.0874) |
| note3 | 270.32(0.0000) | 2.88(0.0909) |
| note4 | 273.13(0.0000) |
| Dependant variable | prix € |
| Independant variable(s) | note note2 note3 note4 |
| Examples | 222 |
| R2 | 0.57628514555513 |
| Adjusted R2 | 0.57436788377031 |
| Sigma error | 0.48443706725716 |
| F-Test(1,221) | 300.57718258319(p < .0000*) |
| Source of variation | SS | df | MS | F Obs | F Stat |
|---|---|---|---|---|---|
| Regression | SSR = 70.54 | dfR = 1 | MSR = 70.54 | MSR/MSE = 300.58 | p < .0000* |
| Error | SSE = 51.86 | dfE = 221 | MSE = 0.23 | ||
| Total | SSTO = 122.40 | dfTO = 222 |
| Parameter | Estimate | SE | T Obs | T Stat |
|---|---|---|---|---|
| Intercept | b0=-1.623148 | s{b0}=0.285159 | t0=-5.692089 | p < .0000* |
| note4 | b1=0.000000 | s{b1}=0.000000 | t1=17.337162 | p < .0000* |
| Step | 1 | 2 |
|---|---|---|
| R2 | 0.5763 | |
| note | 293.38(0.0000) | 0.88(0.3499) |
| note2 | 296.35(0.0000) | 0.87(0.3534) |
| note3 | 298.76(0.0000) | 0.85(0.3571) |
| note4 | 300.58(0.0000) |
| Dependant variable | prix € |
| Independant variable(s) | note note2 note3 note4 |
| Examples | 221 |
| R2 | 0.58585132817898 |
| Adjusted R2 | 0.58396883421616 |
| Sigma error | 0.4753085821036 |
| F-Test(1,220) | 311.21020292703(p < .0000*) |
| Source of variation | SS | df | MS | F Obs | F Stat |
|---|---|---|---|---|---|
| Regression | SSR = 70.31 | dfR = 1 | MSR = 70.31 | MSR/MSE = 311.21 | p < .0000* |
| Error | SSE = 49.70 | dfE = 220 | MSE = 0.23 | ||
| Total | SSTO = 120.01 | dfTO = 221 |
| Parameter | Estimate | SE | T Obs | T Stat |
|---|---|---|---|---|
| Intercept | b0=-1.621906 | s{b0}=0.279786 | t0=-5.796963 | p < .0000* |
| note4 | b1=0.000000 | s{b1}=0.000000 | t1=17.641151 | p < .0000* |
| Step | 1 | 2 |
|---|---|---|
| R2 | 0.5859 | |
| note | 302.81(0.0000) | 1.24(0.2671) |
| note2 | 306.21(0.0000) | 1.22(0.2700) |
| note3 | 309.02(0.0000) | 1.21(0.2732) |
| note4 | 311.21(0.0000) |
| Dependant variable | prix € |
| Independant variable(s) | note note2 note3 note4 |
| Examples | 220 |
| R2 | 0.59842795032766 |
| Adjusted R2 | 0.59659428800038 |
| Sigma error | 0.46794483579386 |
| F-Test(1,219) | 326.35668052268(p < .0000*) |
| Source of variation | SS | df | MS | F Obs | F Stat |
|---|---|---|---|---|---|
| Regression | SSR = 71.46 | dfR = 1 | MSR = 71.46 | MSR/MSE = 326.36 | p < .0000* |
| Error | SSE = 47.95 | dfE = 219 | MSE = 0.22 | ||
| Total | SSTO = 119.42 | dfTO = 220 |
| Parameter | Estimate | SE | T Obs | T Stat |
|---|---|---|---|---|
| Intercept | b0=-1.678650 | s{b0}=0.276183 | t0=-6.078047 | p < .0000* |
| note4 | b1=0.000000 | s{b1}=0.000000 | t1=18.065345 | p < .0000* |
| Step | 1 | 2 |
|---|---|---|
| R2 | 0.5984 | |
| note | 317.86(0.0000) | 1.05(0.3057) |
| note2 | 321.35(0.0000) | 1.04(0.3096) |
| note3 | 324.19(0.0000) | 1.02(0.3138) |
| note4 | 326.36(0.0000) |
| Dependant variable | prix € |
| Independant variable(s) | note note2 note3 note4 |
| Examples | 219 |
| R2 | 0.60747659311291 |
| Adjusted R2 | 0.60567602702627 |
| Sigma error | 0.46131997904096 |
| F-Test(1,218) | 337.38089238767(p < .0000*) |
| Source of variation | SS | df | MS | F Obs | F Stat |
|---|---|---|---|---|---|
| Regression | SSR = 71.80 | dfR = 1 | MSR = 71.80 | MSR/MSE = 337.38 | p < .0000* |
| Error | SSE = 46.39 | dfE = 218 | MSE = 0.21 | ||
| Total | SSTO = 118.19 | dfTO = 219 |
| Parameter | Estimate | SE | T Obs | T Stat |
|---|---|---|---|---|
| Intercept | b0=-1.696701 | s{b0}=0.272354 | t0=-6.229761 | p < .0000* |
| note4 | b1=0.000000 | s{b1}=0.000000 | t1=18.367931 | p < .0000* |
| Step | 1 | 2 |
|---|---|---|
| R2 | 0.6075 | |
| note | 327.89(0.0000) | 1.29(0.2565) |
| note2 | 331.74(0.0000) | 1.27(0.2605) |
| note3 | 334.92(0.0000) | 1.25(0.2648) |
| note4 | 337.38(0.0000) |
| Dependant variable | prix € |
| Independant variable(s) | note note2 note3 note4 |
| Examples | 218 |
| R2 | 0.61668839429413 |
| Adjusted R2 | 0.61492198136461 |
| Sigma error | 0.4545662738987 |
| F-Test(1,217) | 349.11904458357(p < .0000*) |
| Source of variation | SS | df | MS | F Obs | F Stat |
|---|---|---|---|---|---|
| Regression | SSR = 72.14 | dfR = 1 | MSR = 72.14 | MSR/MSE = 349.12 | p < .0000* |
| Error | SSE = 44.84 | dfE = 217 | MSE = 0.21 | ||
| Total | SSTO = 116.98 | dfTO = 218 |
| Parameter | Estimate | SE | T Obs | T Stat |
|---|---|---|---|---|
| Intercept | b0=-1.714804 | s{b0}=0.268448 | t0=-6.387846 | p < .0000* |
| note4 | b1=0.000000 | s{b1}=0.000000 | t1=18.684728 | p < .0000* |
| Step | 1 | 2 |
|---|---|---|
| R2 | 0.6167 | |
| note | 338.54(0.0000) | 1.57(0.2115) |
| note2 | 342.79(0.0000) | 1.54(0.2155) |
| note3 | 346.33(0.0000) | 1.51(0.2198) |
| note4 | 349.12(0.0000) |
| Dependant variable | prix € |
| Independant variable(s) | note note2 note3 note4 |
| Examples | 217 |
| R2 | 0.62430438963193 |
| Adjusted R2 | 0.62256505810245 |
| Sigma error | 0.44771854640564 |
| F-Test(1,216) | 358.93352075204(p < .0000*) |
| Source of variation | SS | df | MS | F Obs | F Stat |
|---|---|---|---|---|---|
| Regression | SSR = 71.95 | dfR = 1 | MSR = 71.95 | MSR/MSE = 358.93 | p < .0000* |
| Error | SSE = 43.30 | dfE = 216 | MSE = 0.20 | ||
| Total | SSTO = 115.25 | dfTO = 217 |
| Parameter | Estimate | SE | T Obs | T Stat |
|---|---|---|---|---|
| Intercept | b0=-1.714119 | s{b0}=0.264404 | t0=-6.482952 | p < .0000* |
| note4 | b1=0.000000 | s{b1}=0.000000 | t1=18.945541 | p < .0000* |
| Step | 1 | 2 |
|---|---|---|
| R2 | 0.6243 | |
| note | 347.01(0.0000) | 2.01(0.1580) |
| note2 | 351.73(0.0000) | 1.98(0.1613) |
| note3 | 355.72(0.0000) | 1.94(0.1648) |
| note4 | 358.93(0.0000) |
| Dependant variable | prix € |
| Independant variable(s) | note note2 note3 note4 |
| Examples | 216 |
| R2 | 0.62434018735318 |
| Adjusted R2 | 0.62259293241064 |
| Sigma error | 0.44091881140337 |
| F-Test(1,215) | 357.32632494053(p < .0000*) |
| Source of variation | SS | df | MS | F Obs | F Stat |
|---|---|---|---|---|---|
| Regression | SSR = 69.47 | dfR = 1 | MSR = 69.47 | MSR/MSE = 357.33 | p < .0000* |
| Error | SSE = 41.80 | dfE = 215 | MSE = 0.19 | ||
| Total | SSTO = 111.27 | dfTO = 216 |
| Parameter | Estimate | SE | T Obs | T Stat |
|---|---|---|---|---|
| Intercept | b0=-1.653792 | s{b0}=0.261293 | t0=-6.329265 | p < .0000* |
| note4 | b1=0.000000 | s{b1}=0.000000 | t1=18.903077 | p < .0000* |
| Step | 1 | 2 |
|---|---|---|
| R2 | 0.6243 | |
| note | 345.07(0.0000) | 2.16(0.1431) |
| note2 | 349.89(0.0000) | 2.14(0.1451) |
| note3 | 353.99(0.0000) | 2.11(0.1473) |
| note4 | 357.33(0.0000) |
| Dependant variable | prix € |
| Independant variable(s) | note note2 note3 note4 |
| Examples | 215 |
| R2 | 0.61644275383059 |
| Adjusted R2 | 0.61465043025036 |
| Sigma error | 0.43445078656561 |
| F-Test(1,214) | 343.93496834494(p < .0000*) |
| Source of variation | SS | df | MS | F Obs | F Stat |
|---|---|---|---|---|---|
| Regression | SSR = 64.92 | dfR = 1 | MSR = 64.92 | MSR/MSE = 343.93 | p < .0000* |
| Error | SSE = 40.39 | dfE = 214 | MSE = 0.19 | ||
| Total | SSTO = 105.31 | dfTO = 215 |
| Parameter | Estimate | SE | T Obs | T Stat |
|---|---|---|---|---|
| Intercept | b0=-1.551820 | s{b0}=0.260156 | t0=-5.964950 | p < .0000* |
| note4 | b1=0.000000 | s{b1}=0.000000 | t1=18.545484 | p < .0000* |
| Step | 1 | 2 |
|---|---|---|
| R2 | 0.6164 | |
| note | 333.38(0.0000) | 1.55(0.2148) |
| note2 | 337.61(0.0000) | 1.53(0.2172) |
| note3 | 341.14(0.0000) | 1.51(0.2199) |
| note4 | 343.93(0.0000) |
| Dependant variable | prix € |
| Independant variable(s) | note note2 note3 note4 |
| Examples | 214 |
| R2 | 0.62677098170372 |
| Adjusted R2 | 0.62501873279153 |
| Sigma error | 0.42818583913255 |
| F-Test(1,213) | 357.69517523666(p < .0000*) |
| Source of variation | SS | df | MS | F Obs | F Stat |
|---|---|---|---|---|---|
| Regression | SSR = 65.58 | dfR = 1 | MSR = 65.58 | MSR/MSE = 357.70 | p < .0000* |
| Error | SSE = 39.05 | dfE = 213 | MSE = 0.18 | ||
| Total | SSTO = 104.63 | dfTO = 214 |
| Parameter | Estimate | SE | T Obs | T Stat |
|---|---|---|---|---|
| Intercept | b0=-1.585809 | s{b0}=0.256713 | t0=-6.177361 | p < .0000* |
| note4 | b1=0.000000 | s{b1}=0.000000 | t1=18.912831 | p < .0000* |
| Step | 1 | 2 |
|---|---|---|
| R2 | 0.6268 | |
| note | 346.35(0.0000) | 1.64(0.2017) |
| note2 | 350.89(0.0000) | 1.62(0.2047) |
| note3 | 354.69(0.0000) | 1.6(0.2079) |
| note4 | 357.7(0.0000) |

