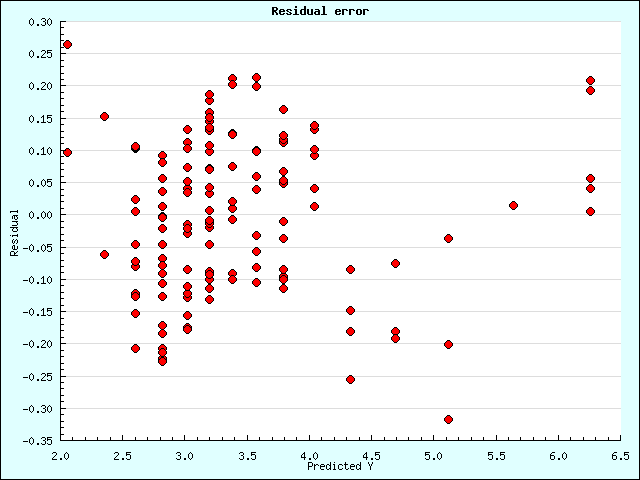
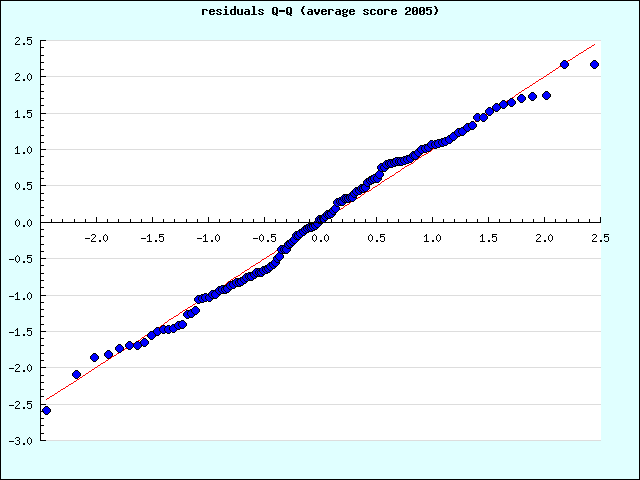
| Dependant variable | prix 2005 € |
| Independant variable(s) | note note2 note3 note4 |
| Examples | 404 |
| R2 | 0.83111934820093 |
| Adjusted R2 | 0.83027914595318 |
| Sigma error | 0.36259919667734 |
| F-Test(2,402) | 989.18962716434(p < .0000*) |
| Source of variation | SS | df | MS | F Obs | F Stat |
|---|---|---|---|---|---|
| Regression | SSR = 260.11 | dfR = 2 | MSR = 130.06 | MSR/MSE = 989.19 | p < .0000* |
| Error | SSE = 52.85 | dfE = 402 | MSE = 0.13 | ||
| Total | SSTO = 312.97 | dfTO = 404 |
| Parameter | Estimate | SE | T Obs | T Stat |
|---|---|---|---|---|
| Intercept | b0=48.733308 | s{b0}=8.149231 | t0=5.980111 | p < .0000* |
| note4 | b1=0.000000 | s{b1}=0.000000 | t1=8.978015 | p < .0000* |
| note | b2=-0.763090 | s{b2}=0.119455 | t2=-6.388124 | p < .0000* |
| Step | 1 | 2 | 3 |
|---|---|---|---|
| R2 | 0.814 | 0.8311 | |
| note | 1584.74(0.0000) | 40.81(0.0000) | |
| note2 | 1647.19(0.0000) | 40.55(0.0000) | 1.6(0.2068) |
| note3 | 1707.1(0.0000) | 40.28(0.0000) | 1.59(0.2084) |
| note4 | 1763.38(0.0000) |
| Dependant variable | prix € |
| Independant variable(s) | note note2 note3 note4 |
| Examples | 403 |
| R2 | 0.83538823448967 |
| Adjusted R2 | 0.8345672281779 |
| Sigma error | 0.35115734860148 |
| F-Test(2,401) | 1017.5174325839(p < .0000*) |
| Source of variation | SS | df | MS | F Obs | F Stat |
|---|---|---|---|---|---|
| Regression | SSR = 250.94 | dfR = 2 | MSR = 125.47 | MSR/MSE = 1017.52 | p < .0000* |
| Error | SSE = 49.45 | dfE = 401 | MSE = 0.12 | ||
| Total | SSTO = 300.39 | dfTO = 403 |
| Parameter | Estimate | SE | T Obs | T Stat |
|---|---|---|---|---|
| Intercept | b0=47.058720 | s{b0}=7.898510 | t0=5.957924 | p < .0000* |
| note4 | b1=0.000000 | s{b1}=0.000000 | t1=9.007165 | p < .0000* |
| note | b2=-0.737439 | s{b2}=0.115788 | t2=-6.368870 | p < .0000* |
| Step | 1 | 2 | 3 |
|---|---|---|---|
| R2 | 0.8187 | 0.8354 | |
| note | 1629.17(0.0000) | 40.56(0.0000) | |
| note2 | 1694.38(0.0000) | 40.35(0.0000) | 1.05(0.3070) |
| note3 | 1756.96(0.0000) | 40.13(0.0000) | 1.03(0.3117) |
| note4 | 1815.77(0.0000) |
| Dependant variable | prix € |
| Independant variable(s) | note note2 note3 note4 |
| Examples | 402 |
| R2 | 0.84130144180414 |
| Adjusted R2 | 0.84050794901316 |
| Sigma error | 0.3435869044523 |
| F-Test(2,400) | 1060.2508949903(p < .0000*) |
| Source of variation | SS | df | MS | F Obs | F Stat |
|---|---|---|---|---|---|
| Regression | SSR = 250.33 | dfR = 2 | MSR = 125.16 | MSR/MSE = 1060.25 | p < .0000* |
| Error | SSE = 47.22 | dfE = 400 | MSE = 0.12 | ||
| Total | SSTO = 297.55 | dfTO = 402 |
| Parameter | Estimate | SE | T Obs | T Stat |
|---|---|---|---|---|
| Intercept | b0=48.482785 | s{b0}=7.735181 | t0=6.267828 | p < .0000* |
| note4 | b1=0.000000 | s{b1}=0.000000 | t1=9.375926 | p < .0000* |
| note | b2=-0.758201 | s{b2}=0.113393 | t2=-6.686514 | p < .0000* |
| Step | 1 | 2 | 3 |
|---|---|---|---|
| R2 | 0.8236 | 0.8413 | |
| note | 1670.54(0.0000) | 44.71(0.0000) | |
| note2 | 1740.44(0.0000) | 44.49(0.0000) | 1.02(0.3139) |
| note3 | 1807.93(0.0000) | 44.26(0.0000) | 1(0.3178) |
| note4 | 1871.77(0.0000) |
| Dependant variable | prix € |
| Independant variable(s) | note note2 note3 note4 |
| Examples | 401 |
| R2 | 0.84611052273108 |
| Adjusted R2 | 0.84533914690517 |
| Sigma error | 0.33830202482102 |
| F-Test(2,399) | 1096.884935088(p < .0000*) |
| Source of variation | SS | df | MS | F Obs | F Stat |
|---|---|---|---|---|---|
| Regression | SSR = 251.07 | dfR = 2 | MSR = 125.54 | MSR/MSE = 1096.88 | p < .0000* |
| Error | SSE = 45.66 | dfE = 399 | MSE = 0.11 | ||
| Total | SSTO = 296.74 | dfTO = 401 |
| Parameter | Estimate | SE | T Obs | T Stat |
|---|---|---|---|---|
| Intercept | b0=48.990221 | s{b0}=7.617446 | t0=6.431319 | p < .0000* |
| note4 | b1=0.000000 | s{b1}=0.000000 | t1=9.593050 | p < .0000* |
| note | b2=-0.765838 | s{b2}=0.111668 | t2=-6.858185 | p < .0000* |
| Step | 1 | 2 | 3 |
|---|---|---|---|
| R2 | 0.828 | 0.8461 | |
| note | 1712.12(0.0000) | 47.03(0.0000) | |
| note2 | 1785.94(0.0000) | 46.78(0.0000) | 1.32(0.2521) |
| note3 | 1857.39(0.0000) | 46.51(0.0000) | 1.3(0.2556) |
| note4 | 1925.17(0.0000) |

