| Dependant variable | prix 2006 |
| Independant variable(s) | note note2 note3 note4 |
| Examples | 366 |
| R2 | 0.7996859981392 |
| Adjusted R2 | 0.79858537175535 |
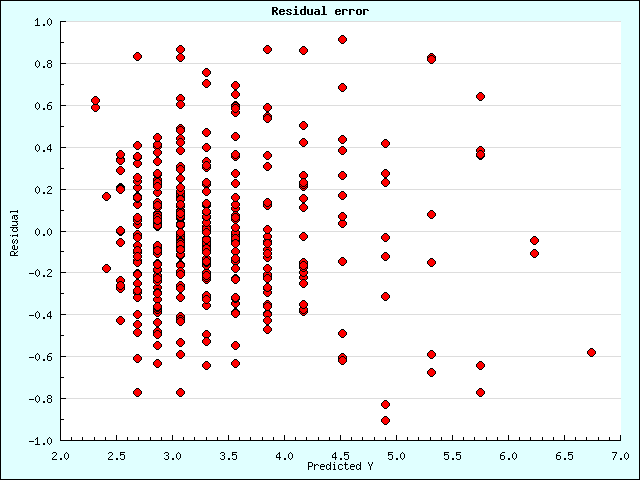
| Sigma error | 0.40062238541508 |
| F-Test(2,364) | 726.57353110279(p < .0000*) |
| Source of variation | SS | df | MS | F Obs | F Stat |
|---|---|---|---|---|---|
| Regression | SSR = 233.23 | dfR = 2 | MSR = 116.61 | MSR/MSE = 726.57 | p < .0000* |
| Error | SSE = 58.42 | dfE = 364 | MSE = 0.16 | ||
| Total | SSTO = 291.65 | dfTO = 366 |
| Parameter | Estimate | SE | T Obs | T Stat |
|---|---|---|---|---|
| Intercept | b0=42.966801 | s{b0}=8.662300 | t0=4.960207 | p < .0000* |
| note4 | b1=0.000000 | s{b1}=0.000000 | t1=7.581774 | p < .0000* |
| note | b2=-0.678316 | s{b2}=0.128142 | t2=-5.293455 | p < .0000* |
| Step | 1 | 2 | 3 |
|---|---|---|---|
| R2 | 0.7843 | 0.7997 | |
| note | 1208.63(0.0000) | 28.02(0.0000) | |
| note2 | 1250.81(0.0000) | 27.77(0.0000) | 2.27(0.1330) |
| note3 | 1290.46(0.0000) | 27.52(0.0000) | 2.26(0.1336) |
| note4 | 1326.9(0.0000) |
| Dependant variable | prix |
| Independant variable(s) | note note2 note3 note4 |
| Examples | 365 |
| R2 | 0.79929613322662 |
| Adjusted R2 | 0.79819032679812 |
| Sigma error | 0.3929929605627 |
| F-Test(2,363) | 722.81740512972(p < .0000*) |
| Source of variation | SS | df | MS | F Obs | F Stat |
|---|---|---|---|---|---|
| Regression | SSR = 223.27 | dfR = 2 | MSR = 111.63 | MSR/MSE = 722.82 | p < .0000* |
| Error | SSE = 56.06 | dfE = 363 | MSE = 0.15 | ||
| Total | SSTO = 279.33 | dfTO = 365 |
| Parameter | Estimate | SE | T Obs | T Stat |
|---|---|---|---|---|
| Intercept | b0=40.526401 | s{b0}=8.520253 | t0=4.756478 | p < .0000* |
| note4 | b1=0.000000 | s{b1}=0.000000 | t1=7.379016 | p < .0000* |
| note | b2=-0.641108 | s{b2}=0.126062 | t2=-5.085649 | p < .0000* |
| Step | 1 | 2 | 3 |
|---|---|---|---|
| R2 | 0.785 | 0.7993 | |
| note | 1213.06(0.0000) | 25.86(0.0000) | |
| note2 | 1254.59(0.0000) | 25.64(0.0000) | 2.14(0.1445) |
| note3 | 1293.46(0.0000) | 25.4(0.0000) | 2.12(0.1463) |
| note4 | 1328.99(0.0000) |
| Dependant variable | prix |
| Independant variable(s) | note note2 note3 note4 |
| Examples | 364 |
| R2 | 0.79873279596837 |
| Adjusted R2 | 0.79762082246544 |
| Sigma error | 0.38565621307495 |
| F-Test(2,362) | 718.30200437205(p < .0000*) |
| Source of variation | SS | df | MS | F Obs | F Stat |
|---|---|---|---|---|---|
| Regression | SSR = 213.67 | dfR = 2 | MSR = 106.83 | MSR/MSE = 718.30 | p < .0000* |
| Error | SSE = 53.84 | dfE = 362 | MSE = 0.15 | ||
| Total | SSTO = 267.51 | dfTO = 364 |
| Parameter | Estimate | SE | T Obs | T Stat |
|---|---|---|---|---|
| Intercept | b0=38.101087 | s{b0}=8.384696 | t0=4.544122 | p < .0000* |
| note4 | b1=0.000000 | s{b1}=0.000000 | t1=7.166171 | p < .0000* |
| note | b2=-0.604130 | s{b2}=0.124078 | t2=-4.868951 | p < .0000* |
| Step | 1 | 2 | 3 |
|---|---|---|---|
| R2 | 0.7856 | 0.7987 | |
| note | 1216.5(0.0000) | 23.71(0.0000) | |
| note2 | 1257.26(0.0000) | 23.5(0.0000) | 2.01(0.1575) |
| note3 | 1295.23(0.0000) | 23.28(0.0000) | 1.98(0.1607) |
| note4 | 1329.72(0.0000) |
| Dependant variable | prix |
| Independant variable(s) | note note2 note3 note4 |
| Examples | 363 |
| R2 | 0.80415541300102 |
| Adjusted R2 | 0.8030704014387 |
| Sigma error | 0.37990217137876 |
| F-Test(2,361) | 741.14916460488(p < .0000*) |
| Source of variation | SS | df | MS | F Obs | F Stat |
|---|---|---|---|---|---|
| Regression | SSR = 213.93 | dfR = 2 | MSR = 106.97 | MSR/MSE = 741.15 | p < .0000* |
| Error | SSE = 52.10 | dfE = 361 | MSE = 0.14 | ||
| Total | SSTO = 266.04 | dfTO = 363 |
| Parameter | Estimate | SE | T Obs | T Stat |
|---|---|---|---|---|
| Intercept | b0=39.160875 | s{b0}=8.265237 | t0=4.738022 | p < .0000* |
| note4 | b1=0.000000 | s{b1}=0.000000 | t1=7.398788 | p < .0000* |
| note | b2=-0.619889 | s{b2}=0.122311 | t2=-5.068137 | p < .0000* |
| Step | 1 | 2 | 3 |
|---|---|---|---|
| R2 | 0.7902 | 0.8042 | |
| note | 1243.02(0.0000) | 25.69(0.0000) | |
| note2 | 1286.25(0.0000) | 25.45(0.0000) | 2.25(0.1346) |
| note3 | 1326.69(0.0000) | 25.21(0.0000) | 2.22(0.1371) |
| note4 | 1363.62(0.0000) |
| Dependant variable | prix |
| Independant variable(s) | note note2 note3 note4 |
| Examples | 362 |
| R2 | 0.80856418974773 |
| Adjusted R2 | 0.80750065746855 |
| Sigma error | 0.37473401801384 |
| F-Test(2,360) | 760.26295165359(p < .0000*) |
| Source of variation | SS | df | MS | F Obs | F Stat |
|---|---|---|---|---|---|
| Regression | SSR = 213.52 | dfR = 2 | MSR = 106.76 | MSR/MSE = 760.26 | p < .0000* |
| Error | SSE = 50.55 | dfE = 360 | MSE = 0.14 | ||
| Total | SSTO = 264.07 | dfTO = 362 |
| Parameter | Estimate | SE | T Obs | T Stat |
|---|---|---|---|---|
| Intercept | b0=40.397966 | s{b0}=8.161305 | t0=4.949940 | p < .0000* |
| note4 | b1=0.000000 | s{b1}=0.000000 | t1=7.640671 | p < .0000* |
| note | b2=-0.638118 | s{b2}=0.120772 | t2=-5.283659 | p < .0000* |
| Step | 1 | 2 | 3 |
|---|---|---|---|
| R2 | 0.7937 | 0.8086 | |
| note | 1261.62(0.0000) | 27.92(0.0000) | |
| note2 | 1307.06(0.0000) | 27.67(0.0000) | 2.21(0.1377) |
| note3 | 1349.79(0.0000) | 27.42(0.0000) | 2.19(0.1400) |
| note4 | 1389.04(0.0000) |
| Dependant variable | prix |
| Independant variable(s) | note note2 note3 note4 |
| Examples | 361 |
| R2 | 0.81352682462898 |
| Adjusted R2 | 0.81248797685533 |
| Sigma error | 0.36945274582467 |
| F-Test(2,359) | 783.10494112817(p < .0000*) |
| Source of variation | SS | df | MS | F Obs | F Stat |
|---|---|---|---|---|---|
| Regression | SSR = 213.78 | dfR = 2 | MSR = 106.89 | MSR/MSE = 783.10 | p < .0000* |
| Error | SSE = 49.00 | dfE = 359 | MSE = 0.14 | ||
| Total | SSTO = 262.78 | dfTO = 361 |
| Parameter | Estimate | SE | T Obs | T Stat |
|---|---|---|---|---|
| Intercept | b0=41.408594 | s{b0}=8.051867 | t0=5.142732 | p < .0000* |
| note4 | b1=0.000000 | s{b1}=0.000000 | t1=7.870815 | p < .0000* |
| note | b2=-0.653145 | s{b2}=0.119153 | t2=-5.481557 | p < .0000* |
| Step | 1 | 2 | 3 |
|---|---|---|---|
| R2 | 0.7979 | 0.8135 | |
| note | 1286.46(0.0000) | 30.05(0.0000) | |
| note2 | 1334.41(0.0000) | 29.78(0.0000) | 2.46(0.1175) |
| note3 | 1379.69(0.0000) | 29.5(0.0000) | 2.44(0.1193) |
| note4 | 1421.47(0.0000) |
| Dependant variable | prix |
| Independant variable(s) | note note2 note3 note4 |
| Examples | 360 |
| R2 | 0.81719441730016 |
| Adjusted R2 | 0.81617315706161 |
| Sigma error | 0.36439835155836 |
| F-Test(2,358) | 800.18234966551(p < .0000*) |
| Source of variation | SS | df | MS | F Obs | F Stat |
|---|---|---|---|---|---|
| Regression | SSR = 212.51 | dfR = 2 | MSR = 106.25 | MSR/MSE = 800.18 | p < .0000* |
| Error | SSE = 47.54 | dfE = 358 | MSE = 0.13 | ||
| Total | SSTO = 260.04 | dfTO = 360 |
| Parameter | Estimate | SE | T Obs | T Stat |
|---|---|---|---|---|
| Intercept | b0=42.568581 | s{b0}=7.949389 | t0=5.354950 | p < .0000* |
| note4 | b1=0.000000 | s{b1}=0.000000 | t1=8.109493 | p < .0000* |
| note | b2=-0.670083 | s{b2}=0.117634 | t2=-5.696350 | p < .0000* |
| Step | 1 | 2 | 3 |
|---|---|---|---|
| R2 | 0.8006 | 0.8172 | |
| note | 1300.07(0.0000) | 32.45(0.0000) | |
| note2 | 1350.09(0.0000) | 32.19(0.0000) | 2.12(0.1459) |
| note3 | 1397.56(0.0000) | 31.91(0.0000) | 2.11(0.1476) |
| note4 | 1441.63(0.0000) |
| Dependant variable | prix |
| Independant variable(s) | note note2 note3 note4 |
| Examples | 359 |
| R2 | 0.8221513592208 |
| Adjusted R2 | 0.82115500829207 |
| Sigma error | 0.35965871496704 |
| F-Test(2,357) | 825.16243575406(p < .0000*) |
| Source of variation | SS | df | MS | F Obs | F Stat |
|---|---|---|---|---|---|
| Regression | SSR = 213.48 | dfR = 2 | MSR = 106.74 | MSR/MSE = 825.16 | p < .0000* |
| Error | SSE = 46.18 | dfE = 357 | MSE = 0.13 | ||
| Total | SSTO = 259.66 | dfTO = 359 |
| Parameter | Estimate | SE | T Obs | T Stat |
|---|---|---|---|---|
| Intercept | b0=42.293395 | s{b0}=7.846453 | t0=5.390129 | p < .0000* |
| note4 | b1=0.000000 | s{b1}=0.000000 | t1=8.191719 | p < .0000* |
| note | b2=-0.666344 | s{b2}=0.116109 | t2=-5.738926 | p < .0000* |
| Step | 1 | 2 | 3 |
|---|---|---|---|
| R2 | 0.8057 | 0.8222 | |
| note | 1336.45(0.0000) | 32.94(0.0000) | |
| note2 | 1388.9(0.0000) | 32.65(0.0000) | 2.49(0.1153) |
| note3 | 1438.71(0.0000) | 32.36(0.0000) | 2.47(0.1170) |
| note4 | 1484.93(0.0000) |
| Dependant variable | prix |
| Independant variable(s) | note note2 note3 note4 |
| Examples | 358 |
| R2 | 0.82689496556086 |
| Adjusted R2 | 0.82592246536739 |
| Sigma error | 0.35508924801543 |
| F-Test(2,356) | 850.27743038626(p < .0000*) |
| Source of variation | SS | df | MS | F Obs | F Stat |
|---|---|---|---|---|---|
| Regression | SSR = 214.42 | dfR = 2 | MSR = 107.21 | MSR/MSE = 850.28 | p < .0000* |
| Error | SSE = 44.89 | dfE = 356 | MSE = 0.13 | ||
| Total | SSTO = 259.31 | dfTO = 358 |
| Parameter | Estimate | SE | T Obs | T Stat |
|---|---|---|---|---|
| Intercept | b0=42.023782 | s{b0}=7.747222 | t0=5.424368 | p < .0000* |
| note4 | b1=0.000000 | s{b1}=0.000000 | t1=8.272675 | p < .0000* |
| note | b2=-0.662680 | s{b2}=0.114640 | t2=-5.780528 | p < .0000* |
| Step | 1 | 2 | 3 |
|---|---|---|---|
| R2 | 0.8106 | 0.8269 | |
| note | 1372.8(0.0000) | 33.41(0.0000) | |
| note2 | 1427.75(0.0000) | 33.11(0.0000) | 2.89(0.0898) |
| note3 | 1479.94(0.0000) | 32.79(0.0000) | 2.86(0.0915) |
| note4 | 1528.37(0.0000) |
| Dependant variable | prix |
| Independant variable(s) | note note2 note3 note4 |
| Examples | 357 |
| R2 | 0.82328215303787 |
| Adjusted R2 | 0.82228655953385 |
| Sigma error | 0.35067358016953 |
| F-Test(2,355) | 826.92599913542(p < .0000*) |
| Source of variation | SS | df | MS | F Obs | F Stat |
|---|---|---|---|---|---|
| Regression | SSR = 203.38 | dfR = 2 | MSR = 101.69 | MSR/MSE = 826.93 | p < .0000* |
| Error | SSE = 43.66 | dfE = 355 | MSE = 0.12 | ||
| Total | SSTO = 247.03 | dfTO = 357 |
| Parameter | Estimate | SE | T Obs | T Stat |
|---|---|---|---|---|
| Intercept | b0=38.703612 | s{b0}=7.722431 | t0=5.011843 | p < .0000* |
| note4 | b1=0.000000 | s{b1}=0.000000 | t1=7.819441 | p < .0000* |
| note | b2=-0.612537 | s{b2}=0.114317 | t2=-5.358226 | p < .0000* |
| Step | 1 | 2 | 3 |
|---|---|---|---|
| R2 | 0.809 | 0.8233 | |
| note | 1362.52(0.0000) | 28.71(0.0000) | |
| note2 | 1414.34(0.0000) | 28.39(0.0000) | 3.76(0.0534) |
| note3 | 1463.09(0.0000) | 28.06(0.0000) | 3.72(0.0547) |
| note4 | 1507.78(0.0000) |
| Dependant variable | prix |
| Independant variable(s) | note note2 note3 note4 |
| Examples | 356 |
| R2 | 0.82172668582284 |
| Adjusted R2 | 0.82071949195744 |
| Sigma error | 0.34606173941189 |
| F-Test(2,354) | 815.85751665619(p < .0000*) |
| Source of variation | SS | df | MS | F Obs | F Stat |
|---|---|---|---|---|---|
| Regression | SSR = 195.41 | dfR = 2 | MSR = 97.71 | MSR/MSE = 815.86 | p < .0000* |
| Error | SSE = 42.39 | dfE = 354 | MSE = 0.12 | ||
| Total | SSTO = 237.81 | dfTO = 356 |
| Parameter | Estimate | SE | T Obs | T Stat |
|---|---|---|---|---|
| Intercept | b0=36.727567 | s{b0}=7.645172 | t0=4.804021 | p < .0000* |
| note4 | b1=0.000000 | s{b1}=0.000000 | t1=7.601277 | p < .0000* |
| note | b2=-0.582420 | s{b2}=0.113195 | t2=-5.145282 | p < .0000* |
| Step | 1 | 2 | 3 |
|---|---|---|---|
| R2 | 0.8084 | 0.8217 | |
| note | 1356.91(0.0000) | 26.47(0.0000) | |
| note2 | 1407.4(0.0000) | 26.17(0.0000) | 3.64(0.0574) |
| note3 | 1454.67(0.0000) | 25.86(0.0000) | 3.58(0.0593) |
| note4 | 1497.77(0.0000) |
| Dependant variable | prix |
| Independant variable(s) | note note2 note3 note4 |
| Examples | 355 |
| R2 | 0.82544073339713 |
| Adjusted R2 | 0.82445172905377 |
| Sigma error | 0.34242244977678 |
| F-Test(2,353) | 834.61790531033(p < .0000*) |
| Source of variation | SS | df | MS | F Obs | F Stat |
|---|---|---|---|---|---|
| Regression | SSR = 195.72 | dfR = 2 | MSR = 97.86 | MSR/MSE = 834.62 | p < .0000* |
| Error | SSE = 41.39 | dfE = 353 | MSE = 0.12 | ||
| Total | SSTO = 237.11 | dfTO = 355 |
| Parameter | Estimate | SE | T Obs | T Stat |
|---|---|---|---|---|
| Intercept | b0=35.717317 | s{b0}=7.572646 | t0=4.716623 | p < .0000* |
| note4 | b1=0.000000 | s{b1}=0.000000 | t1=7.545267 | p < .0000* |
| note | b2=-0.567533 | s{b2}=0.112120 | t2=-5.061834 | p < .0000* |
| Step | 1 | 2 | 3 |
|---|---|---|---|
| R2 | 0.8128 | 0.8254 | |
| note | 1392.32(0.0000) | 25.62(0.0000) | |
| note2 | 1444.23(0.0000) | 25.32(0.0000) | 3.83(0.0511) |
| note3 | 1492.7(0.0000) | 25(0.0000) | 3.77(0.0530) |
| note4 | 1536.73(0.0000) |
| Dependant variable | prix |
| Independant variable(s) | note note2 note3 note4 |
| Examples | 354 |
| R2 | 0.82798379637775 |
| Adjusted R2 | 0.82700643158444 |
| Sigma error | 0.33891665280971 |
| F-Test(2,352) | 847.15942506496(p < .0000*) |
| Source of variation | SS | df | MS | F Obs | F Stat |
|---|---|---|---|---|---|
| Regression | SSR = 194.62 | dfR = 2 | MSR = 97.31 | MSR/MSE = 847.16 | p < .0000* |
| Error | SSE = 40.43 | dfE = 352 | MSE = 0.11 | ||
| Total | SSTO = 235.05 | dfTO = 354 |
| Parameter | Estimate | SE | T Obs | T Stat |
|---|---|---|---|---|
| Intercept | b0=36.652384 | s{b0}=7.502105 | t0=4.885613 | p < .0000* |
| note4 | b1=0.000000 | s{b1}=0.000000 | t1=7.733001 | p < .0000* |
| note | b2=-0.581180 | s{b2}=0.111073 | t2=-5.232429 | p < .0000* |
| Step | 1 | 2 | 3 |
|---|---|---|---|
| R2 | 0.8146 | 0.828 | |
| note | 1401.13(0.0000) | 27.38(0.0000) | |
| note2 | 1454.76(0.0000) | 27.07(0.0000) | 3.46(0.0637) |
| note3 | 1505.08(0.0000) | 26.77(0.0000) | 3.41(0.0658) |
| note4 | 1551.04(0.0000) |
| Dependant variable | prix |
| Independant variable(s) | note note2 note3 note4 |
| Examples | 353 |
| R2 | 0.83192122973703 |
| Adjusted R2 | 0.83096351594636 |
| Sigma error | 0.33547394526012 |
| F-Test(2,351) | 868.65328435243(p < .0000*) |
| Source of variation | SS | df | MS | F Obs | F Stat |
|---|---|---|---|---|---|
| Regression | SSR = 195.52 | dfR = 2 | MSR = 97.76 | MSR/MSE = 868.65 | p < .0000* |
| Error | SSE = 39.50 | dfE = 351 | MSE = 0.11 | ||
| Total | SSTO = 235.02 | dfTO = 353 |
| Parameter | Estimate | SE | T Obs | T Stat |
|---|---|---|---|---|
| Intercept | b0=36.553241 | s{b0}=7.425979 | t0=4.922346 | p < .0000* |
| note | b1=0.000000 | s{b1}=0.000000 | t1=7.817671 | p < .0000* |
| note2 | b2=-0.580176 | s{b2}=0.109945 | t2=-5.276969 | p < .0000* |
| Step | 1 | 2 | 3 | 4 |
|---|---|---|---|---|
| R2 | 0 | 0.8319 | 0.834 | |
| note | 1431.68(0.0000) | 27.85(0.0000) | ||
| note2 | 1487.73(0.0000) | 27.5(0.0000) | 4.44(0.0358) | |
| note3 | 1540.32(0.0000) | 27.15(0.0000) | 4.38(0.0370) | 3.59(0.0590) |
| note4 | 1588.32(0.0000) | 3.54(0.0607) |
| Dependant variable | prix |
| Independant variable(s) | note note2 note3 note4 |
| Examples | 352 |
| R2 | 0.83526930942112 |
| Adjusted R2 | 0.83432799118924 |
| Sigma error | 0.33205690705758 |
| F-Test(2,350) | 887.3399888936(p < .0000*) |
| Source of variation | SS | df | MS | F Obs | F Stat |
|---|---|---|---|---|---|
| Regression | SSR = 195.68 | dfR = 2 | MSR = 97.84 | MSR/MSE = 887.34 | p < .0000* |
| Error | SSE = 38.59 | dfE = 350 | MSE = 0.11 | ||
| Total | SSTO = 234.27 | dfTO = 352 |
| Parameter | Estimate | SE | T Obs | T Stat |
|---|---|---|---|---|
| Intercept | b0=37.351164 | s{b0}=7.355581 | t0=5.077935 | p < .0000* |
| note | b1=0.000000 | s{b1}=0.000000 | t1=8.001418 | p < .0000* |
| note2 | b2=-0.592040 | s{b2}=0.108903 | t2=-5.436384 | p < .0000* |
| Step | 1 | 2 | 3 | 4 |
|---|---|---|---|---|
| R2 | 0 | 0.8353 | 0.8375 | |
| note | 1450.26(0.0000) | 29.55(0.0000) | ||
| note2 | 1508.58(0.0000) | 29.18(0.0000) | 4.75(0.0300) | |
| note3 | 1563.5(0.0000) | 28.81(0.0000) | 4.7(0.0309) | 3.84(0.0507) |
| note4 | 1613.84(0.0000) | 3.8(0.0521) |